What can be done when Unity mysteriously throws an ArgumentException when building a project for Android? In this post I’ll describe the techniques and tools I used to track down the root cause for this issue.
Prologue
When using a tool such as Unity, a simple click of a “Build” button often hides a long and complex process involving different modules and tools. When this process fails, it may be hard to determine the exact reason. One approach would be to try looking for what you did wrong (what did I install? did I pass the wrong parameters somewhere?).
A different approach – the one we’ll explore today, is to dig deeper under the surface to look for the cause of error.
Reproduction
The first stop when attempting to fix an issue is to reproduce it at will. Since the original issue was reported by another user, I started by attempting to get the same exception on my machine: I launched Unity, and tried to build an empty project for Android.
Lucky for me, the stars aligned, and I got the exception on the first attempt, without doing anything special. Many times, reproducing another user’s problem won’t be that easy, and in that case these steps should be performed directly on the machine that demonstrated the error.
How did I get here? (Getting context)
As a developer, you are in control of what errors are shown to your users. This means that internal errors and exceptions may be caught internally (“swallowed”) and silenced or replaced by some other, more friendly message.
In our case, the only piece of information at hand is this message displayed in the Unity console:
Unfortunately, this doesn’t reveal any information as to where this happened, nor what Unity attempted to do at that time.
Getting a proper context is important for understanding what went wrong.
Since this exception looks like it comes from internal Unity code written in C# (Mono), we can use the debugger and break execution when this specific exception occurs.
Breaking on a specific exception
This is a very useful debugger feature that allows breaking execution when particular exception types are thrown (similar to setting a breakpoint).
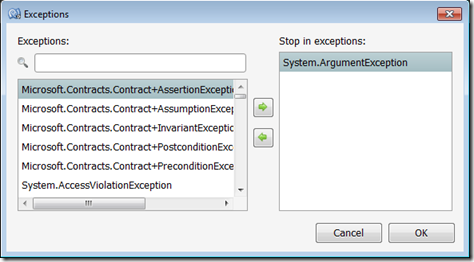
We need to configure the debugger to break on ArgumentException. This is done by launching MonoDevelop and running these steps:
- Attach to the running Unity process (Run –> Attach to Process)
- Open the Exceptions menu (Run –> Exceptions)
- Add System.ArgumentException to Stop in exceptions:
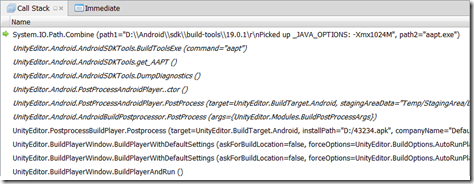
After hitting OK, the debugger is properly configured, and indeed when repeating the build in Unity, the debugger breaks exactly as the ArgumentException is thrown, and we can examine the stack trace:
At this point, we have the first piece of information we need – the exception is thrown after calling Path.Combine with some weird first argument (see path1).
Going in reverse
With the stack trace in hand, we must dig a bit deeper to understand how unity got that weird looking path that was used for the call to Path.Combine.
Decompiling
Using a C# decompiler (Reflector, dotPeek), we can peek at the code in the UnityEditor.Android.dll assembly (located under the Unity installation folder).
Looking at the method at the top of the stack trace, we can see the call to Path.Combine:
Since the first argument to Path.Combine is the interesting one, we’d like to know how does SDKBuildToolsDir receive its value. This is pretty easy using the decompiler, and we can see that this is how it gets its value:
It appears that Unity is running some external command whose output is captured and is assigned to SDKBulidToolsDir. We can now attempt to see how the code assembles the command line and invokes the tool, but there’s a better and easier option.
Sniffing for processes
Process Monitor (procmon) is a nifty little tool that acts as a “sniffer” for various real-time machine wide activities (process information, networking, registry access, file access). It is particularly useful for figuring out what processes were invoked (by Unity), and what were their arguments.
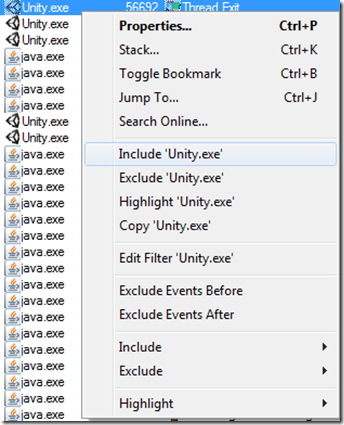
Running procmon and then starting a new build gives us a nice capture of the data we need. After the build fails we can stop procmon from capturing (CTRL-E) to keep the captured trace clean and focused on the issue at hand. The trace will probably contain information from many running processes, but we can filter it to show events originating from Unity.exe. This is done by right-clicking a trace line from Unity.exe and selecting “Include Unity.exe”):
We should further filter the results for showing only process/thread activities (from the toolbar), as seen in this image:
This gets us only Unity.exe traces of process and thread events. From this point it’s pretty straightforward to find that Unity creates a new Java process with the following details (paths may vary on your machine):
“C:\Program Files\Java\jdk1.7.0_17\bin\java.exe” -Xmx1024M -Dcom.android.sdkmanager.toolsdir=“D:/Android/sdk\tools” -Dfile.encoding=UTF8 -jar “D:/Unity/Editor/Data/BuildTargetTools/AndroidPlayer\sdktools.jar” –
Running this exact command from a command prompt generates this output:
Eureka!
Putting it all together, from all we’ve learned it looks like Unity is using a custom Java based tool, captures its output in a variable and uses that information as part of the build process. In cases where _JAVA_OPTIONS environment variable is defined, Java will print out the options used to the console (this will happen also when invoking java with no arguments), however Unity’s build process does not deal with this scenario very well.
The issue was reported and acknowledged by Unity in this Bug Report
Takeaways
- Reproduce the issue before attempting to fix it
- Determine a context for the failure (e.g: stack trace)
- Reverse engineering can be your friend
Tools Used
- Debugger (MonoDevelop) – Installed with Unity
- C# decompiler
- Process Monitor (included in SysInternals Suite) http://technet.microsoft.com/en-us/sysinternals/bb842062.aspx


you’re my heeeero (I admire the solution as much as the way you hacked into unity to find it)